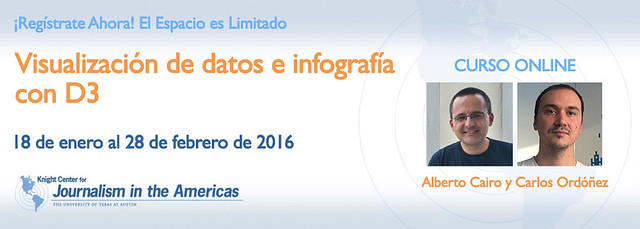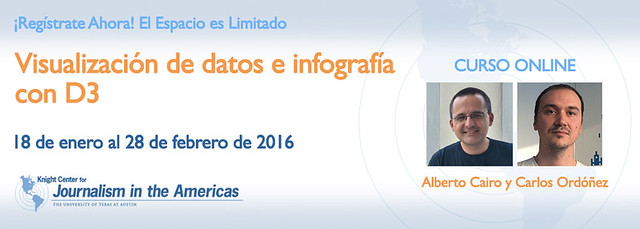
“Data Visualization and Infographics with D3”, one of the most popular online courses in English offered this year by the Knight Center for Journalism in the Americas, will be offered in Spanish starting January 18, 2016.
Both times that this course was offered in English in 2015, spaces filled up quickly. The Knight Center now offers this course in Spanish after receiving repeated requests. Be sure to register as soon as possible to ensure your participation.
One of the main elements of this course is an introduction to using D3, programming in Javascript that allows the creation of animated and interactive data visualizations.
D3 is in high demand in media companies worldwide, offering alternatives to the basic displays of pre-built data. In the course, students will learn techniques that combine design and programming to create custom interactive displays.

The online course, which takes place from January 18 to February 28, will be taught in Spanish through JournalismCourses.org, the distance learning platform of the Knight Center.
Instructors will be Alberto Cairo, Professor of the School of Communication at the University of Miami and author of The Functional Art, and Carlos Diego Ordonez, coordinator of the development team and frontend developer of Bestiario, one of the first data visualization companies in Europe.
Weekly course modules will cover topics such as creating graphics to communicate and analyze data, a basic introduction to HTML, CSS, SVG and JavaScript, creating visuals using D3.js, and techniques to make the best choices on graphs to present data.
Here you can find more details about the course. No previous experience in design or programming is required to participate in this program.
This six-week course will cost U.S. $95, which may be paid by using a credit card that has international validity. This rate includes the cost of the participation certificate (in PDF format), which will be issued by the Knight Center after verifying that the student has met the minimum requirements at the end of the course. The certificate, however, does not account for any academic accreditation.
“Data Visualization and Infographics with D3” will be divided into six weekly modules including multimedia materials and discussion forums. Most of the course activities can be performed in the days and times that best suit the student. The number of participants is limited and the registration can be made at this link.
“At the Knight Center, we are happy to attend to the many requests we have received from journalists and other professionals who want training in D3 in the Spanish language,” said Professor Rosental Alves, founder and director of the Knight Center. “We were lucky to find, in Barcelona, Carlos Ordóñez de Diego, an expert in data visualization and D3.js, who debuts as Knight Center instructor beside the veteran Alberto Cairo, a world leader in computer graphics.”
The Knight Center for Journalism in the Americas was created by Professor Rosental Alves, Knight Chair in Journalism and UNESCO Chair in Communication at the School of Journalism at the University of Texas at Austin in 2002. In the past, the Center received large contributions from the John S. and James L. Knight Foundations, as well as other donors such as the Open Society Foundation. Currently, the Center operates with the support of the Moody College of Communication at the University of Texas at Austin and donations from the general public.
Watch this video from the instructors who give more information about the course:

Knight Center for Journalism in the Americas
300 West Dean Keeton
Room 3.212
Austin, TX, 78712
Phone: 512-471-1391
Email: journalismcourses@austin.utexas.edu