Editors now expect reporters on every news desk to know how to find and use databases to uncover and explain complex topics. However, knowing where to start or how to best manage the data is a major challenge. Additionally, many of the resulting stories are dry, technical and lack the ability to engage readers.

Editors now expect reporters on every news desk to know how to find and use databases to uncover and explain complex topics. However, knowing where to start or how to best manage the data is a major challenge. Additionally, many of the resulting stories are dry, technical and lack the ability to engage readers.
The new massive open online course from the Knight Center will teach you how to use data as a source to tell stories with engaging narratives.
“Data Exploration and Storytelling: Finding Stories in Data with Exploratory Analysis and Visualization,” will take place from Jan. 16 to Feb. 26, 2017. Click here to register for the six-week course with Alberto Cairo and Heather Krause.
The course will teach students how to extract journalistic stories from data using visualization, exploratory data analysis and other techniques. Participants will leave knowing how to find data, how to understand it, how to build stories using that data and how to implement best practices around ethics and data.
The six weekly modules of the course are organized as follows:

“I’m really happy about teaching a Massive Open Online Course again. This one is going to be quite different than the previous ones, as the focus will be not just data visualization or infographics, but mainly how to analyze data, filter it, summarize it, and then present it as a story or a series of graphics,” said Cairo. “Also, the opportunity of working with Heather Krause is really exciting, as she’s a talented statistician and journalist, and statistical thinking, that is something that we journalists and communicators, in general, desperately need.”
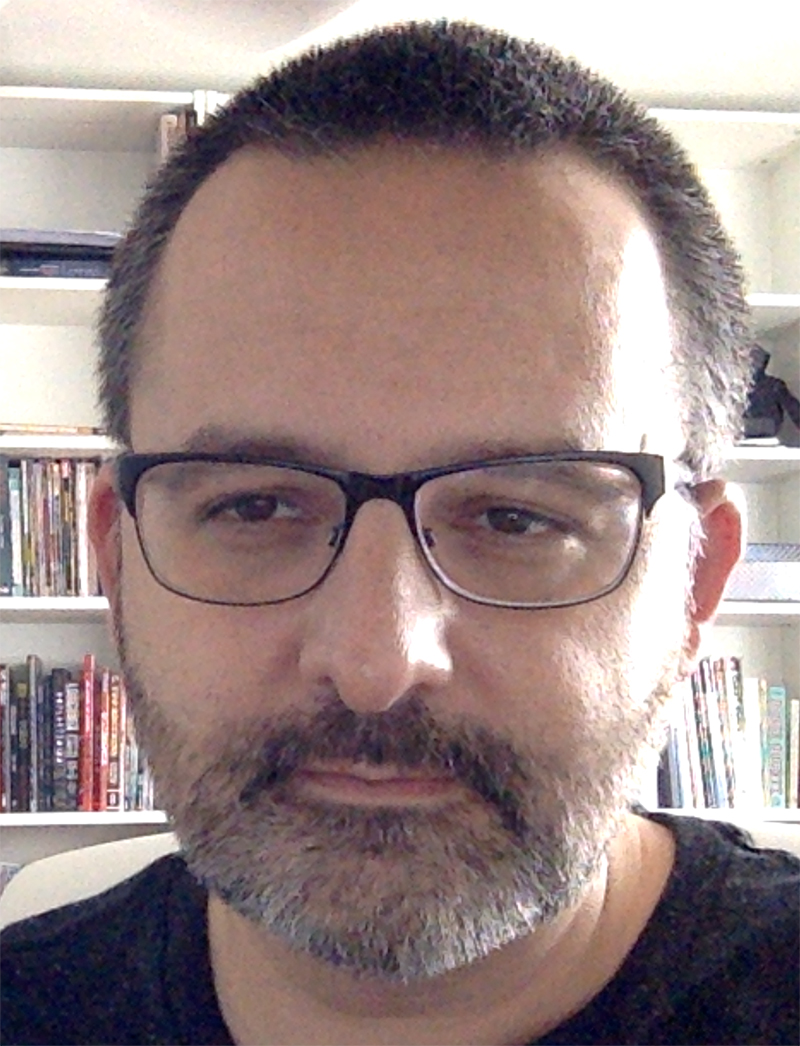
Cairo, a popular instructor of Knight Center courses, taught our first MOOC in 2012, “Introduction to Infographics and Data Visualization,” and has since been an instructor for seven more courses exploring those topics in English, Spanish and Portuguese. He holds a Knight Chair at the School of Communication of the University of Miami and is author of “The Truthful Art” and “The Functional Art.”
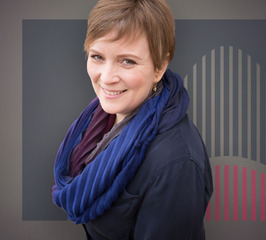
Krause, an experienced data scientist and expert in data journalism, is a new instructor to the Knight Center. She is the founder and principal data scientist of Datassist, a data science company that helps nonprofits and journalists to tell important stories.

“I have learned so much about storytelling from working with journalists over the years. They often ask me about the ‘magic’ behind transforming complex data into something that can add to their stories. How do you spot a narrative in a bunch of numbers? And how can you tell if what the data says is true? In this MOOC we’ll be working together to learn this and more,” Krause said. “Finding stories in data is part art and part science. I hope to give back to a community that has shown me so much.”
“We have already offered several online courses focused on data-journalism, but this one is different, with a very original approach,” said professor Rosental Alves, founder and director of the Knight Center at the University of Texas at Austin. “Journalists will learn how to ‘interview’ the data and find great stories. Then, they will learn how to present those stories in the most friendly and effective way. These kinds of skills are in demand in newsrooms all over the world.”
Cairo and Krause will teach using videos, presentations, readings discussion forums and weekly quizzes.
The course is open to anyone interested in learning about exploring stories with data. Instructors will use Microsoft Excel and Tableau Public to show examples, but it is also possible to follow the course using Google Sheets instead of Excel.
Like all Knight Center courses, Data Exploration and Storytelling is asynchronous, meaning students can log into the course and complete activities throughout the week at their own pace. However, there are weekly deadline for each module.
The course is free, but participants who want to receive a certificate of completion must comply with course requirements and pay an online administrative fee of $30 using an international credit card. The certificate will be issued only to students who have actively participated in the course and completed the proposed tests and exercises. The certificates can be downloaded from the internet in PDF format after the Knight Center verifies that course requirements were met. No formal course credit of any kind is associated with this certificate.
The Knight Center for Journalism in the Americas was created in 2002 by Professor Rosental Alves, Knight Chair in Journalism and UNESCO Chair in Communication at the School of Journalism at the University of Texas at Austin. The Knight Center’s distance learning program continues with support from the John S. and James L. Knight Foundation, the Moody College of Communication at the University of Texas and other donors; as well as income from registration fees and the issuance of certificates. Since 2012, the MOOCs and other online journalism courses from the Knight Center have reached more than 85,000 people from 169 countries.

Knight Center for Journalism in the Americas
300 West Dean Keeton
Room 3.212
Austin, TX, 78712
Phone: 512-471-1391
Email: journalismcourses@austin.utexas.edu