We are in the era of data, which holds seemingly limitless opportunities for finding and telling important stories.
But sorting through huge amounts of information, making sense of the numbers and statistics, and finding a way to communicate that data in an easily comprehensible manner is not easy if you do not know where to start.
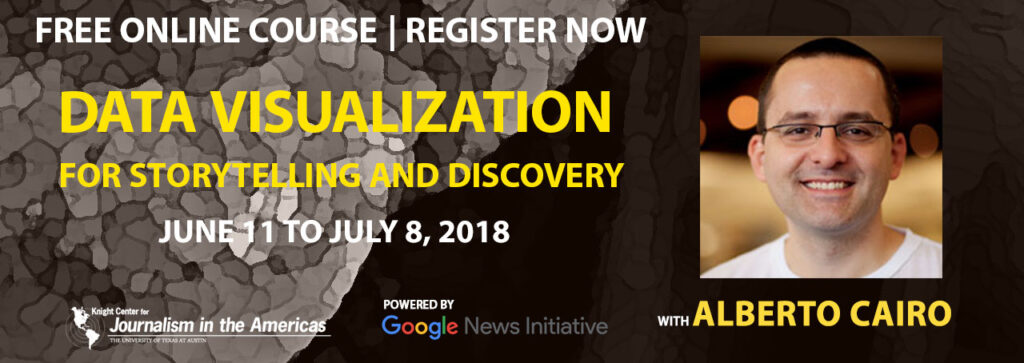
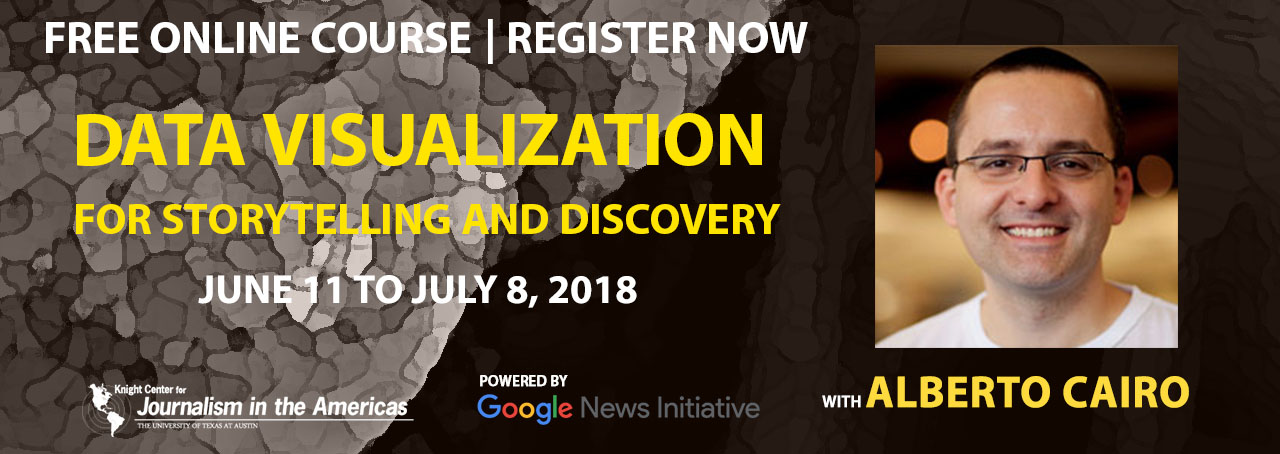
That’s why the Knight Center is offering the free massive open online course (MOOC), “Data Visualization for Storytelling and Discovery,” with popular instructor Alberto Cairo. The four-week course, which runs from June 11 to July 8, is powered by Google News Initiative. The course is open to anyone interested in learning how to tell stories with data. No previous experience with data visualization or design is necessary. Register now!

“The purpose of this course is to show you that designing these kinds of visualizations is not magic,” Cairo said. “Anybody can learn to produce a good data visualization if you learn some elementary principles of design and also if you learn certain freely available tools.”
The course will teach students how to use data visualization to discover interesting facts, trends and patterns in data. Cairo will then show how to use static and interactive graphics, charts and maps to communicate those insights to different audiences.
The course is divided into four weekly modules:
Cairo will use online videos, presentations, readings, quizzes and discussion forums to teach the course. Students will learn how to use different graphical representations like histograms, bar graphics, maps, line charts and scatter plots, and tools like Google Sheets, Data Wrangler, Excel, INZight and Flourish.
Students can share their projects produced during week four of the course in discussion forums, and receive feedback from colleagues.
Cairo will also provide links to additional resources for students to continue learning and improving their data visualization skills once the course is over.
“I’m very excited about this brand new MOOC for several reasons. First, the conceptual side is entirely updated, going even beyond my book The Truthful Art,” Cairo said. “Second, I’ll be introducing and teaching two free visualization tools that are powerful and a delight to use, INZight and Flourish. I think that people will have lots of fun.”
No previous experience with data visualization is required. The course is open to anyone interested in using data visualization to tell stories. Journalists, editors, technology professionals, students and faculty are invited to enroll. Students just need an Internet connection and web browser.
Like all Knight Center courses, this MOOC will be asynchronous, meaning that students can complete the lessons and activities in the days and times most convenient for them. However, there are suggested weekly deadlines so they do not fall behind.
The course is free, but a certificate of participation can be earned by participating in the discussion forums, successfully completing weekly quizzes, and paying an administrative fee of US $30 by credit card. No formal course credit is associated with the certificate.
“We are delighted to partner with Google News Initiative to offer this excellent online course with Alberto Cairo, one of the best and most successful experts in data visualization in the world, and a veteran of the Knight Center’s program of massive open online courses,” said professor Rosental Alves, founder and director of the Knight Center for Journalism in the Americas.
“In this course, Alberto Cairo will open the doors of data visualization to people who have no previous experience with it, as well as with designers. At the same time, he will present several new tools and techniques that will be useful for those who are already working with data visualization,” professor Alves said.
Cairo is a veteran and popular instructor for the Knight Center’s MOOC program. This will be his tenth course since he taught the very first MOOC for the Knight Center in 2012, “Introduction to Infographics and Data Visualization.”
Cairo is the Knight Chair in Visual Journalism at the University of Miami and the director of the visualization program at the university’s Center for Computational Science. He also works as a freelancer and permanent consultant for companies like Google. Prior to entering academia, Cairo was director of infographics and multimedia at Spain’s El Mundo and Editora Globo in Brazil. He has authored two well-known references in the world of data visualization, “The Functional Art: An Introduction to Information Graphics and Visualization” and “The Truthful Art: Data, Charts and Maps for Communication.”
This is the Knight Center’s first course in English supported by the recently launched Google News Initiative. However, Google has been a long-time partner of the Knight Center for its distance learning program and together they have already trained more than 35,000 people with courses in Portuguese and Spanish.
Google News Initiative (GNI) is Google’s initiative to foster the growth of journalism in the digital age. GNI marks a milestone in Google’s 15-year commitment to the news industry and reflects the company’s collaborative efforts to help the industry build a stronger future.
Thanks to donations from the Knight Foundation, the Knight Center for Journalism in the Americas was created in 2002 by Professor Rosental Alves, who holds the Knight Chair in International Journalism at the Journalism School of the University of Texas at Austin’s Moody College of Communication. The Knight Center distance education program began in 2003 and is funded in part by the Knight Foundation. Over the past five years, Knight Center MOOCs have reached more than 135,000 people in more than 170 countries.