Update: Registration for this course closed on November 2, 2015, after reaching capacity. We are considering offering it again in the future.
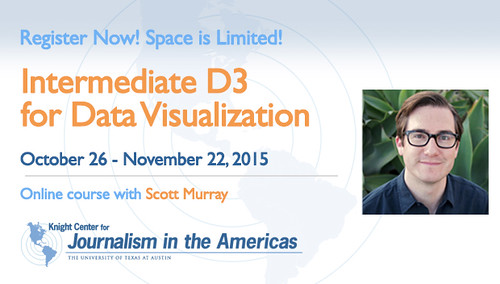
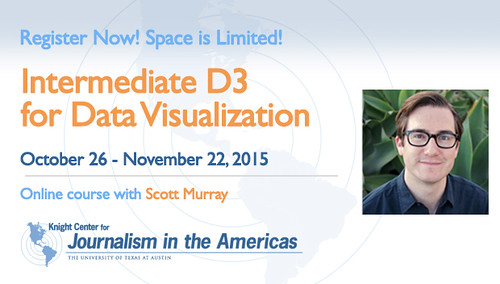
Building on the popular introductory data visualization course offered earlier this year, the Knight Center for Journalism in the Americas is launching an intermediate-level course that will build participants’ D3 visualization skills.
The course, “Intermediate D3 for Data Visualization”, will be taught by Scott Murray and assisted by Natalia Mazotte and hosted in English at JournalismCourses.org, the distance learning program of the Knight Center. The first module opens on October 26 and the course runs until November 22. The cost is $95. Sign up here.
“This course will give you additional practice with D3, helping you get comfortable moving beyond the basics. We’ll cover the importance of page design, creating stacked bar and area charts, and — of course! — geographic maps with D3,” Murray said. “I have made sure to keep all the examples simple, so you can focus on one thing at a time.”

Participants should have prior experience with the web and D3/JavaScript, but they don’t need to have taken the introductory course with the Knight Center. All students will have access to resources to freshen up on the basics. Registration can be done at this link. Keep in mind that there are a limited number of spots available.
“Intermediate D3 for Data Visualization” will be divided into weekly modules that include multimedia materials, quizzes and discussion forums. Each week has a different focus: polished charts, stack layout, geographic data and plotting data on maps. Students will learn things like how to make and share bar charts in D3, how to create area charts in D3, how to render a map as SVG paths using D3’s built-in projections and how to encode data visually on map paths.
Most of the course activities can be completed in the days and times that best suit the student. However, there are suggested weekly deadlines.
An electronic certificate of completion is available for those that successfully complete the course. However, no formal course credit is associated with this certificate.
Murray is an Assistant Professor of Design at the University of San Francisco and author of “Interactive Data Visualization for the Web: An Introduction to Designing with D3.” This is the third course he has taught for the distance learning program of the Knight Center.
The first data visualization massive open online course (MOOC) offered by the Knight Center reached thousands of people in more than 150 countries. There were also two editions of a big online course (BOC) on basics of D3. This upcoming course is the first time the Knight Center will offer an intermediate-level course on the same topic.
“We at the Knight Center are proud to help journalists around the world with training on the cutting edge techniques, such as Data-Driven Document or D3.js, that help them to build interactive data visualization pieces,” said Rosental Alves, founder of the Knight Center for Journalism in the Americas at the University of Texas at Austin. “We are surrounded by big data, and journalists and news organizations have been struggling to present the data in the most effective and nicest way possible.”
Alves, who holds the Knight Chair in Journalism and the UNESCO Chair in Communication at the University of Texas at Austin School of Journalism, created the Knight Center for Journalism in the Americas in 2002. In the past, the Center was financed by major grants from the John S. and James L. Knight Foundation, as well from other donors, such as Open Society Foundations. Currently, the Center receives support from the University of Texas at Austin’s Moody College of Communication and donations from the public.